Metrics
Our metrics feature is beta for now. However, we want to provide some core metrics which can be directly collected from Couper.
Prometheus
Couper provides a built-in Prometheus exporter. It is configurable with settings like port or service_name label. If enabled the default scrape target port is 9090.
Grafana Dashboard
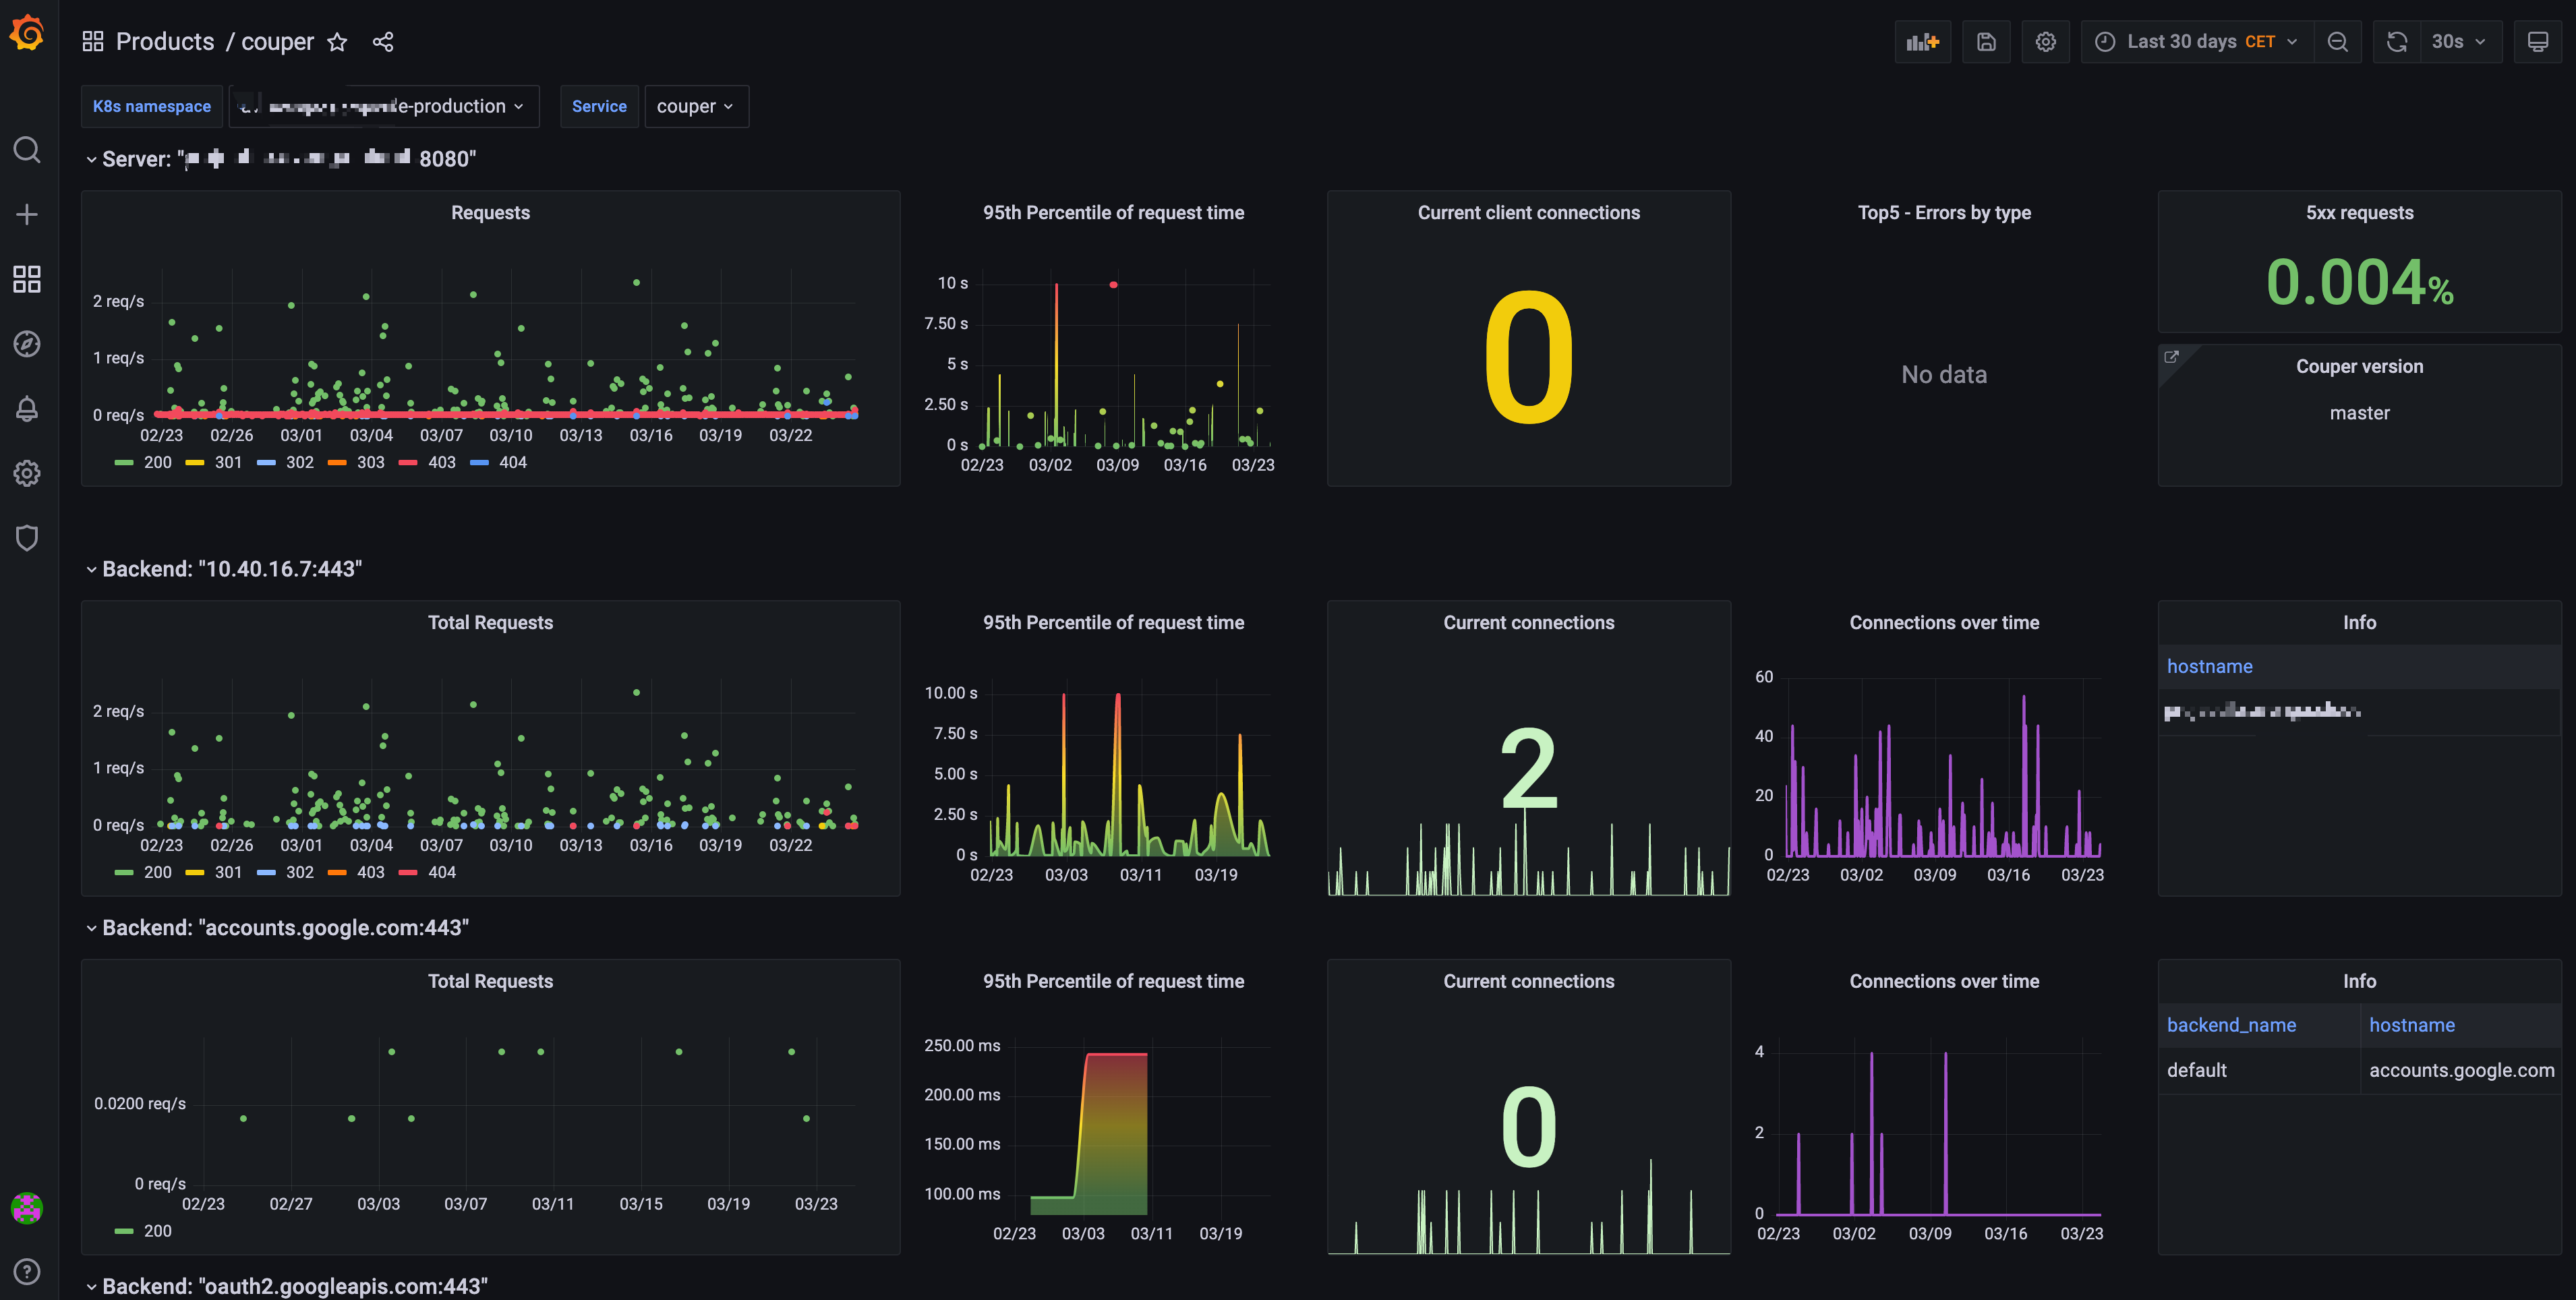
Couper provides a maintained Grafana dashboard which you can find here: grafana.json and import this JSON model to your grafana instance. You may have to set your Datasource to your Prometheus one.
If you’re missing some configuration options or have feedback: Feel free to open a discussion or an issue if something does not work as expected or shown values does not make any sense.
Preview
Developers
If you are interested in contributing to our metrics or refine the grafana dashboard: make docker-telemetry will spin up the stack for you.